
Account overview
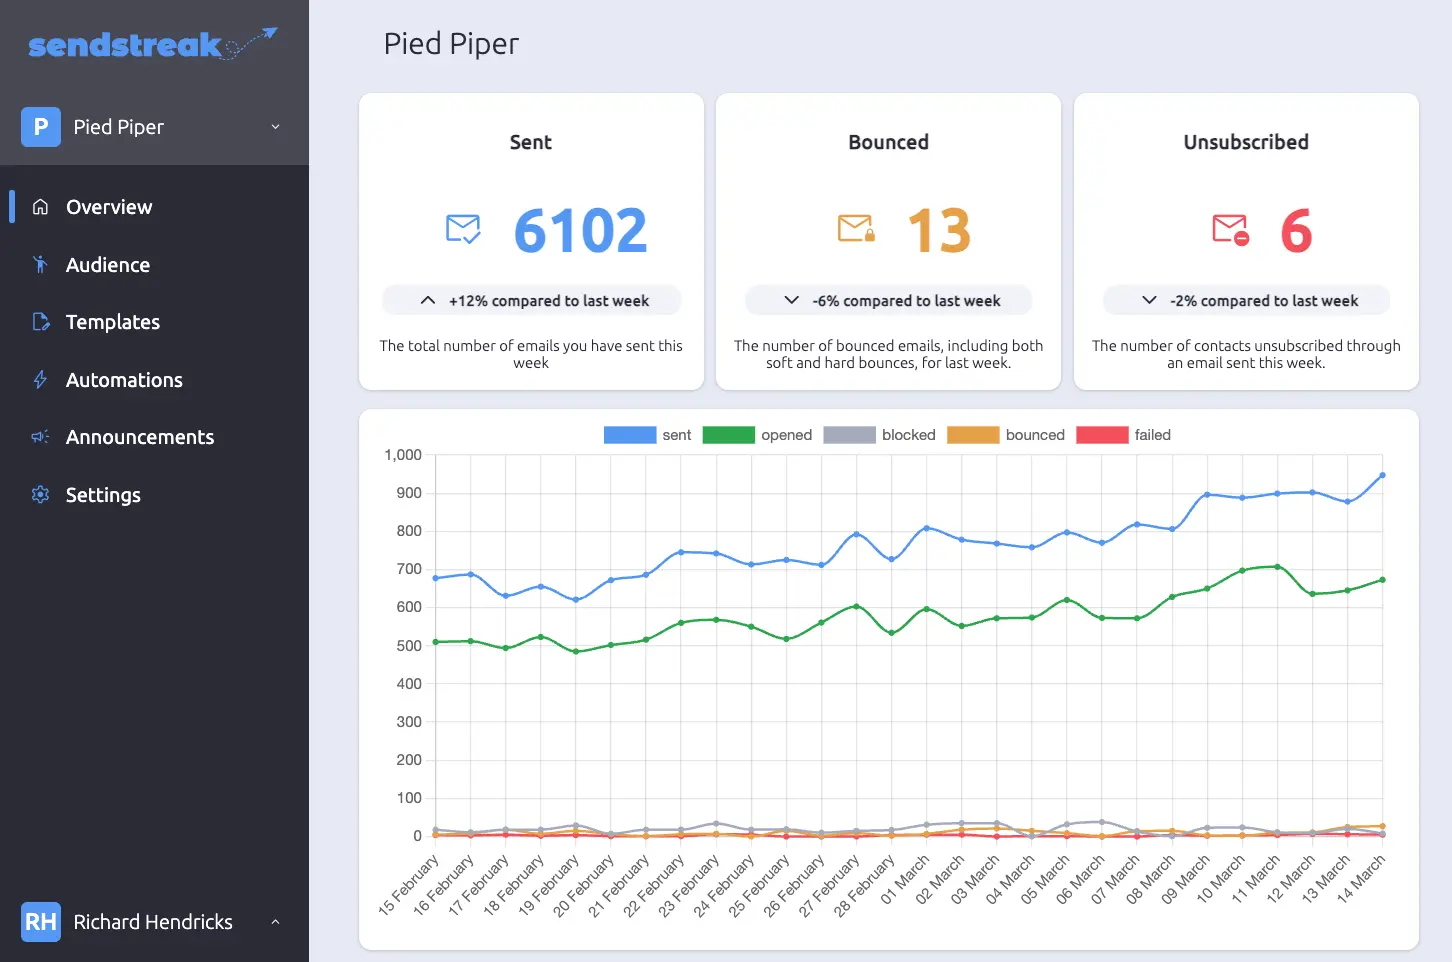
The account overview screen is where you can quickly see how your email automation and marketing campaigns are performing.
Widgets
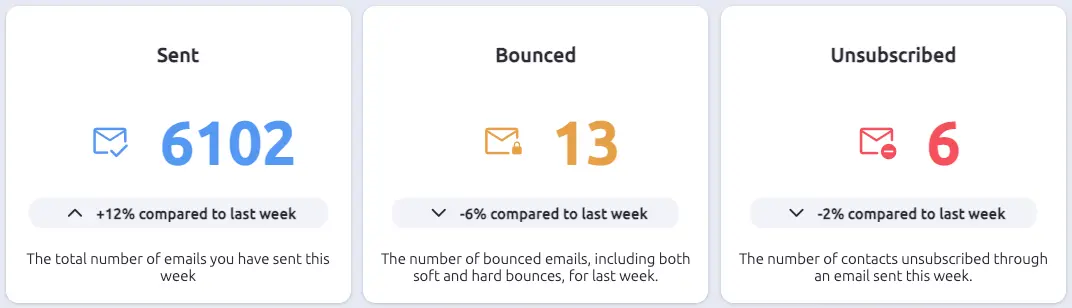
The top-level widgets give you a snapshot of the past week’s performance. Each widget also shows a week-over-week percentage comparison so you can spot trends at a glance.
-
mark_email_read Sent: The total number of emails sent this week, regardless of status or delivery outcome. Significant changes may indicate shifts in your automations, transactional emails, or recent campaign sends.
-
ads_click Clicked: The number of emails where a recipient followed a link this week. SendStreak rewrites the links in your HTML emails so it can count the clicks and then forward the recipient to the original destination. This usually runs smaller than your opened count and should not be added to it, though a recipient whose email client blocks images can register a click without ever registering an open. You can turn link rewriting off for the whole account under Settings, Account details, or exempt a single link by adding a
data-s2-no-trackattribute to its anchor tag. -
mail_lock Bounced: The number of emails that were not delivered to the intended recipients this week. This includes both soft bounces (temporary failures), hard bounces (permanent failures such as invalid addresses or full mailboxes), and bounce-blocked emails. Bounce-blocked emails are messages that SendStreak prevented from being sent because the recipient address had previously bounced - this protects your sender reputation by avoiding repeated delivery attempts to known-bad addresses. Monitoring bounces helps you identify and address delivery issues early.
-
unsubscribe Unsubscribed: The number of contacts who unsubscribed through an email sent this week. This covers both full unsubscribes and partial topic-level unsubscribes from campaign emails. Use this metric to gauge audience engagement and refine your targeting and content.
Monthly chart
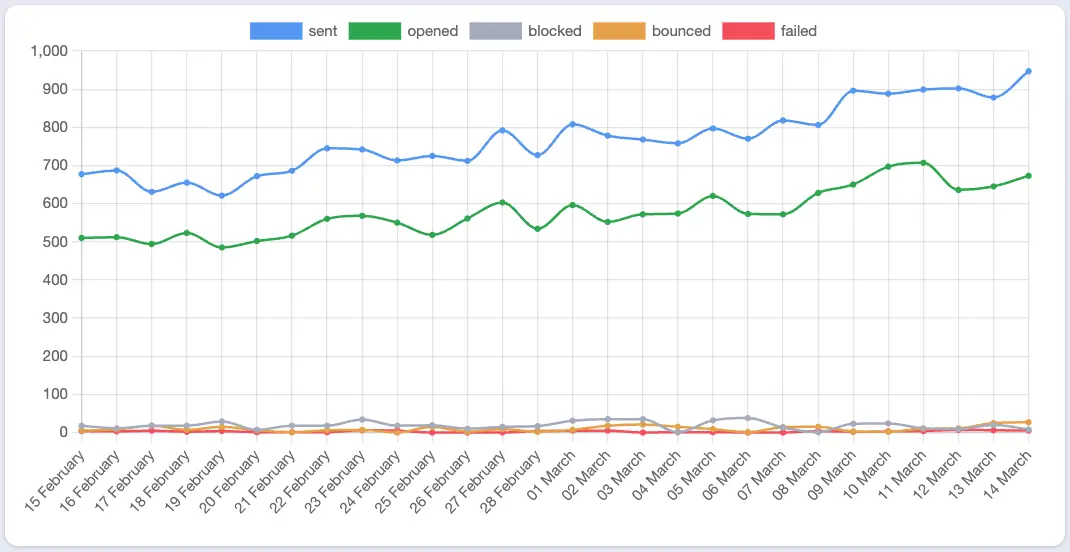
The monthly overview chart shows daily email activity for the past month. Six metrics are plotted as stacked bars:
- Sent (blue): Total emails sent.
- Opened (green): Emails opened by recipients.
- Clicked (purple): Emails where a recipient followed a tracked link.
- Blocked (gray): Emails blocked before delivery, for example bounced contacts that were filtered out.
- Bounced (orange): Emails that bounced after the delivery attempt.
- Failed (red): Emails that failed to send due to server errors.
Hover over any bar to see the exact count for that day. While the chart covers similar ground as the widgets, it helps you pinpoint daily variations and understand trends over time.
Try SendStreak for Free now!